If you use runkeeper and pay for a yearly subscription (runkeeper elite), you can export your data and plot all of your activities simultaneously using R. I’ve written a script for doing so (Special thanks to flowing data which has a tutorial that helped with a few key parts of this).
The script does a few unique things.
- Runkeeper exports data in gpx format. If you ever pause an activity within runkeeper or you lose GPS reception briefly, the GPS path will get split into multiple paths within the same file. The script will retain all paths and plot them separately.
- This script will merge in the type of activities so you can plot different types of activities by color.
- Finally, cluster analysis is used to segregate different locations when plotting. If you are like me and have moved around a bit – this is necessary as plotting distant locations on the same map (e.g. Chicago and Boston) is not feasible and results in distant locations being plotted as single points.
Directions
- Export your runkeeper data. The option is available for subscribers only under the settings menu.
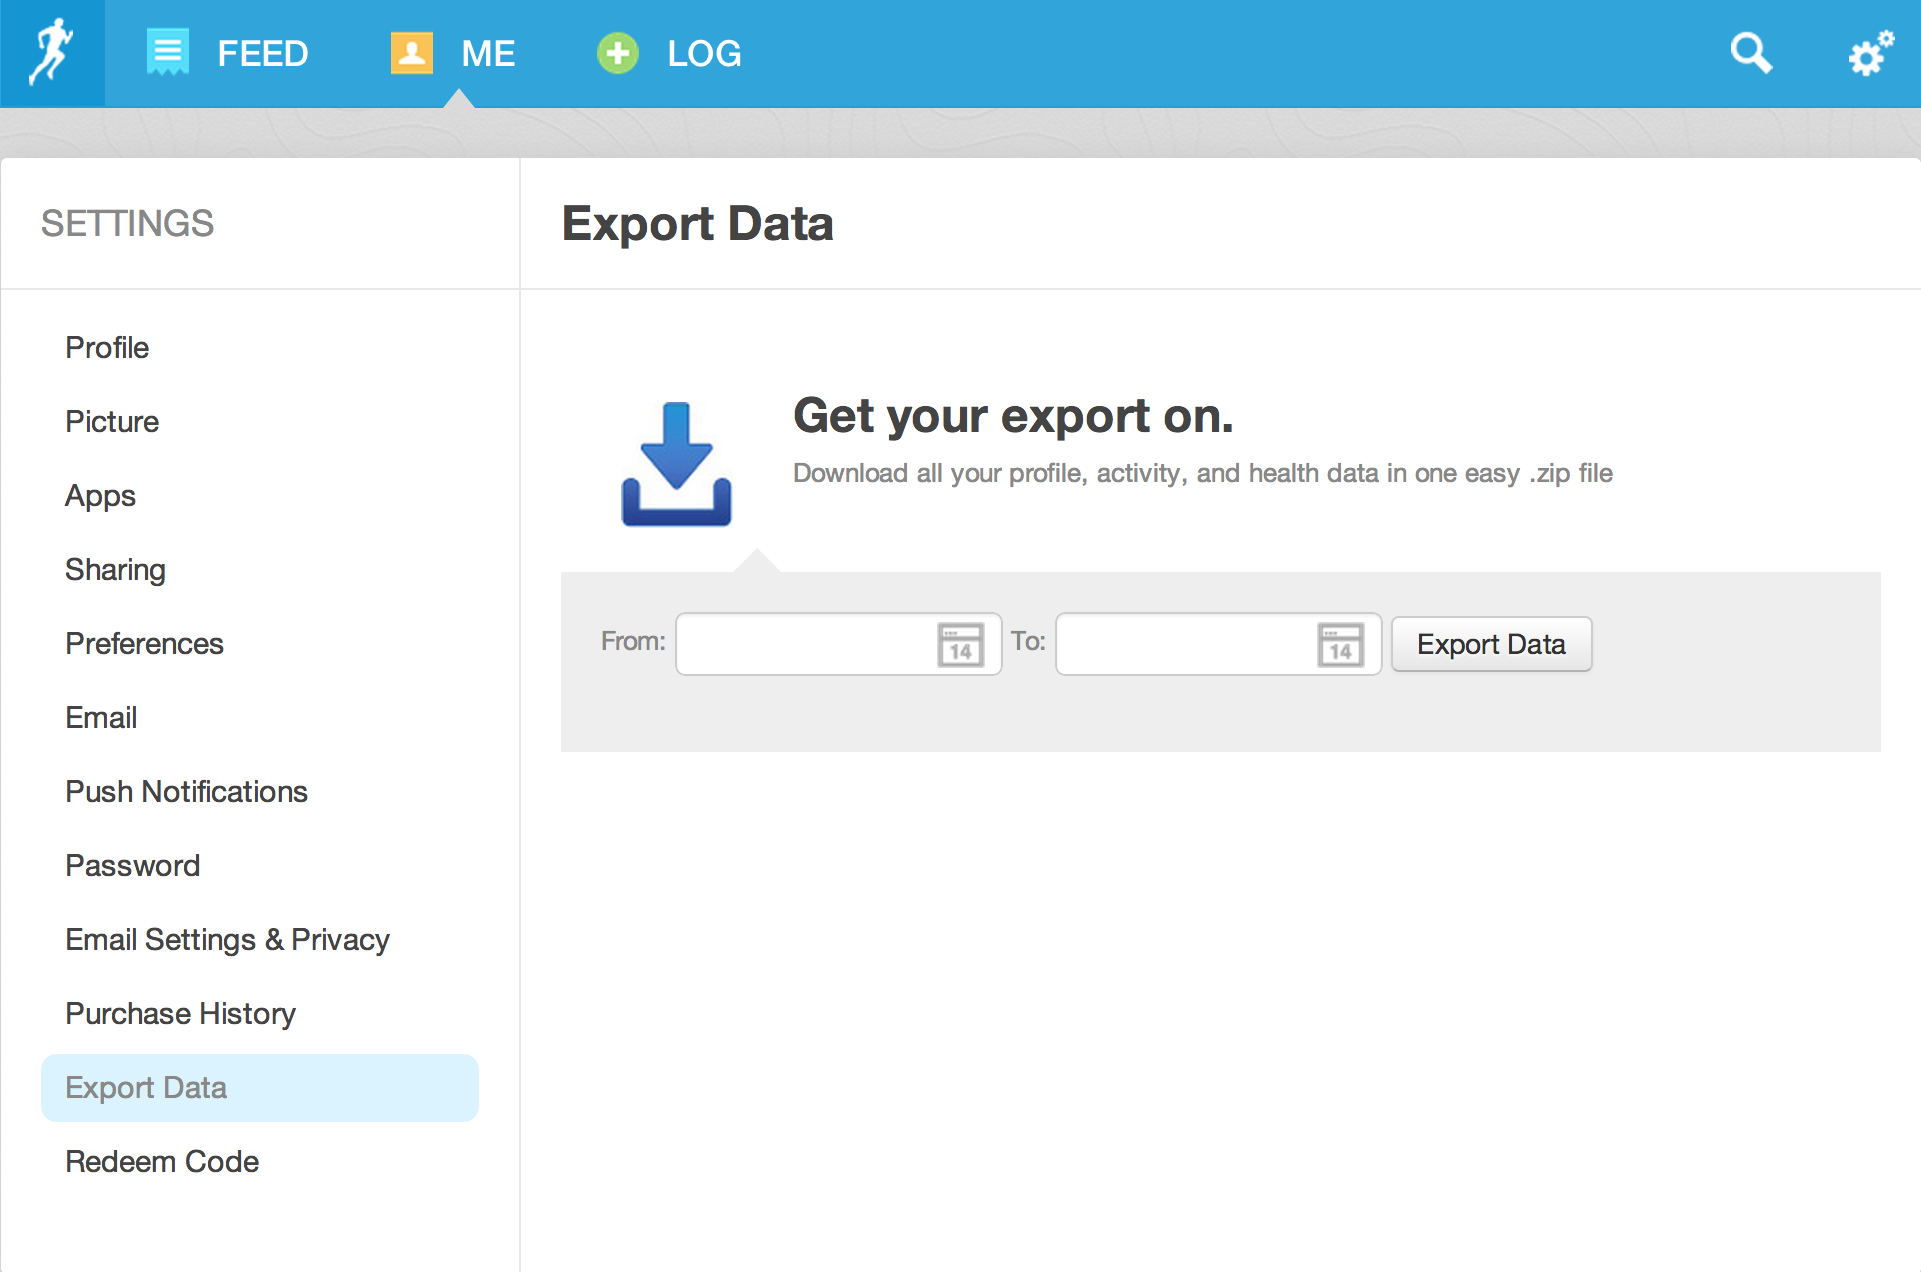
- Place the script below within a folder containing your runkeeper data. Set the
num_locationsvariable to the number of places you have lived/run. This will be used to pull out the number of distinct running locations automatically. - Install the necessary R packages. You can run the following code within R to do so.
install.packages("fpc")
install.packages("plyr")
install.packages("dplyr")
install.packages("mapproj")
- Run the script below from within R Studio or on unix based machines using
RScript plot_runkeeper.R. If you are using Rstudio, be sure to set the working directory usingsetwd()
# Special thanks for insights from flowingdata.com regarding this.

library(plotKML)
library(plyr)
library(dplyr)
library(fpc)

num_locations <- 5

# Usage: Place this script in the directory containing your runkeeper data. You can run from terminal using 'Rscript map_runkeeper.R', or
# set your working directory to the location and run within RStudio (use setwd("~/location/of/runkeeper/data")).
# See below on how to set the number of clusters.

# GPX files downloaded from Runkeeper
files <- dir(pattern = "\\.gpx")

# Generate vectors for data frame
index <- c()
latitude <- c()
longitude <- c()
file <- c()

c <- 1 # Set up Counter

#
for (f in 1:length(files)) {
  curr_route <- readGPX(files[f])
# Treat interrupted GPS paths as seperate routes (useful if you occasionally stop running..walk for a bit, and start again like I do.)
for (i in curr_route$tracks[[1]]) {
  c <- c + 1
  location <- i
  file <- c(file,rep(files[f], dim(location)[1]))
  index <- c(index, rep(c, dim(location)[1]))
  latitude <- c(latitude, location$lat)
  longitude <- c(longitude, location$lon)
}
}
routes <- data.frame(cbind(index, latitude, longitude,file))

# Because the routes dataframe takes a while to generate for some folks - save it!
save(routes, file="routes.Rdata")
# Use to load as needed.
load("routes.Rdata")

# Fix data types
routes$file <- as.character(routes$file)
routes$latitude <- as.numeric(levels(routes$latitude)[routes$latitude])
routes$longitude <- as.numeric(levels(routes$longitude)[routes$longitude])
routes <- transform(routes, index = as.numeric(index))

# Load Meta Data
meta_data <- read.csv("cardioActivities.csv", stringsAsFactors=FALSE)
meta_data <- rename(meta_data, c("GPX.File" = "file"))

# Bind routes
routes <- left_join(routes, meta_data, by="file") %.%
  arrange(index)


# Use this function specify activity color if you have multiple activities.
activity_color <- function(activity) {
  if (activity=="Cycling") {
    color = "#00000060"
  } else if (activity=="Hiking") {
    color = "#00000060"
  } else {
    color = "#0080ff60"
  }
  color
}

# Identify clusters of points, which will correspond to locations you have run. For example,
# I have run in Boston, Iowa City, Chicago, and a few other cities. You will want to set the minimum krange
# to the number of cities you have run in (5 in my case).
clusters <- pamk(routes[,c("latitude", "longitude")], krange=num_locations:20, diss=T, usepam=F)$pamobject$medoids

# Plot Everything
for (r in 1:max(row(clusters))) {
  print(r)
  lat_range <- clusters[r,][1] + rnorm(20, sd=0.1)
  lon_range <-clusters[r,][2] + rnorm(20, sd=0.1)
  setroutes <- filter(routes, (latitude > min(lat_range) & latitude < max(lat_range)),
                      longitude > min(lon_range) &  longitude < max(lon_range))

  routeIds <- unique(setroutes$index)

  # Albers projection
  locProj <- mapproject(setroutes$longitude, setroutes$latitude, "rectangular", par=38)
  setroutes$latproj <- locProj$x
  setroutes$lonproj <- locProj$y


  # Map the projected points
  pdf(sprintf("%s-all.pdf", r))

  plot(setroutes$latproj, setroutes$lonproj, type="n", asp=1, axes=FALSE, xlab="", ylab="")
  for (i in routeIds) {
    currRoute <- subset(setroutes, index==i)
    lines(currRoute$latproj, currRoute$lonproj, col=activity_color(currRoute$Type), lwd=0.4)
  }
  dev.off()
}